Explore Inclusivity Index data
Use Tableau to work through a large Upper School 7-12 data set, confirming expectations, finding new insights, and testing your hypotheses.
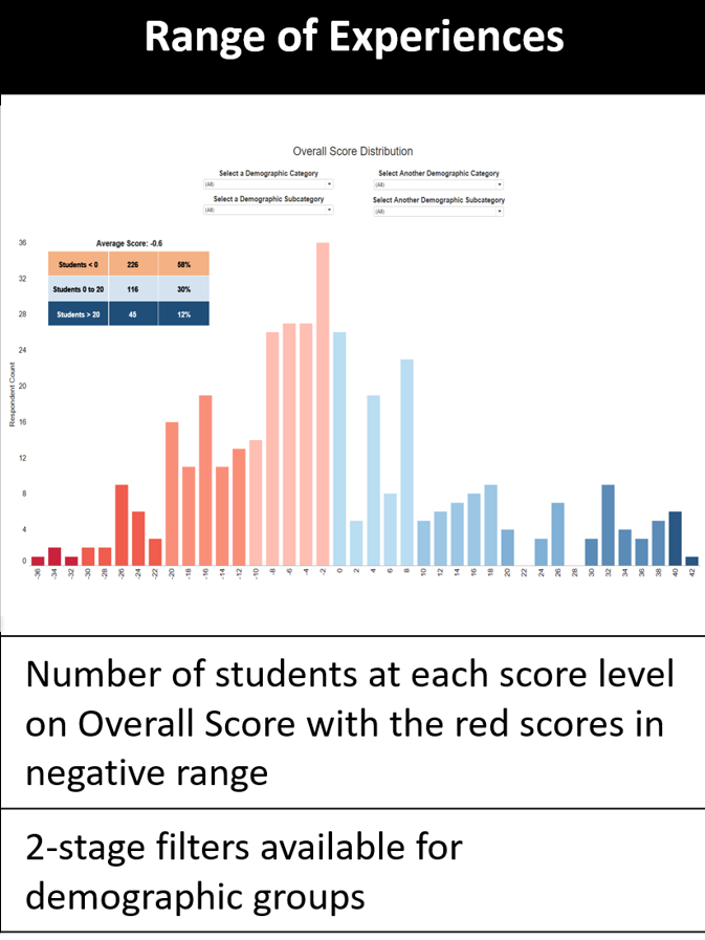
The three tools each have filtering capability to contrast multiple identities or assess each of 14 demographic categories.
The tools include:
Range of Experiences
Quality Ranking by Identity
Experience Lenses