
Learn About the Inclusivity index
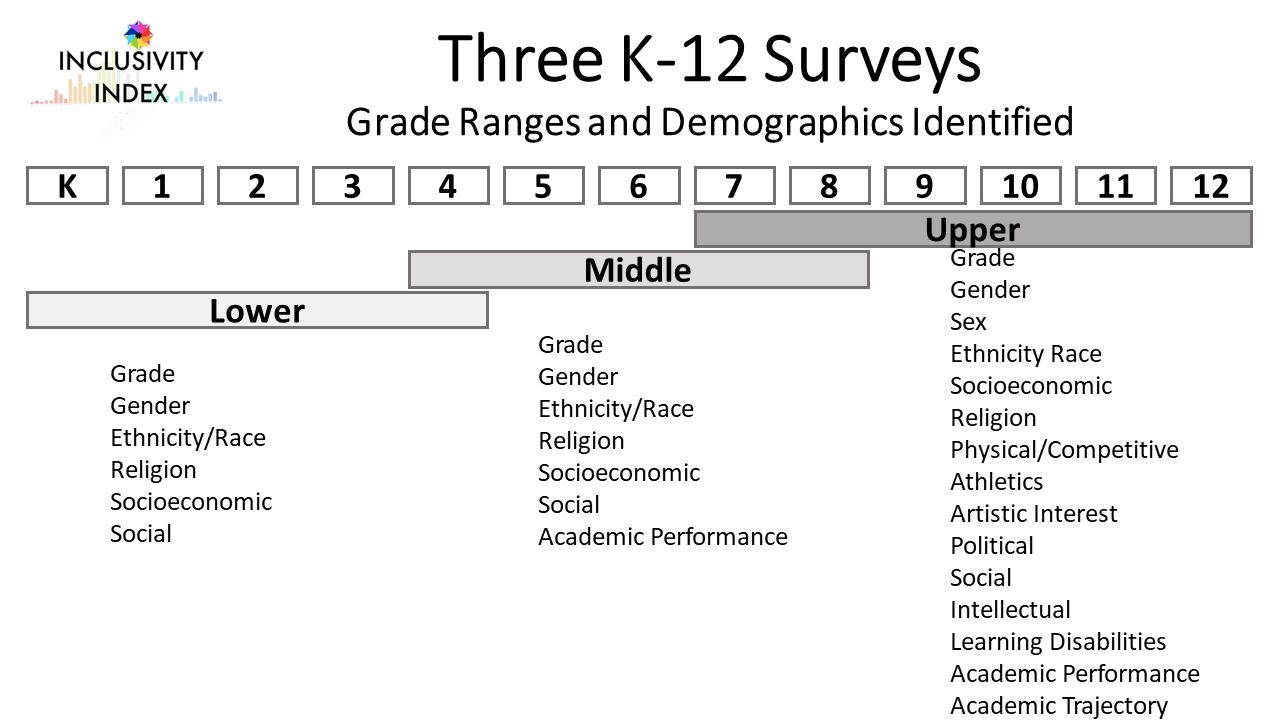
Structure of the survey: the Inclusivity Index uses a choice-based research approach and is offered in three versions for Lower, Middle and Upper School students. Each version studies qualities of the school first, followed by demographic identity selections. All three versions are tuned to a 15 minute duration while the qualities and demographic categories vary consistent with age and development stage.
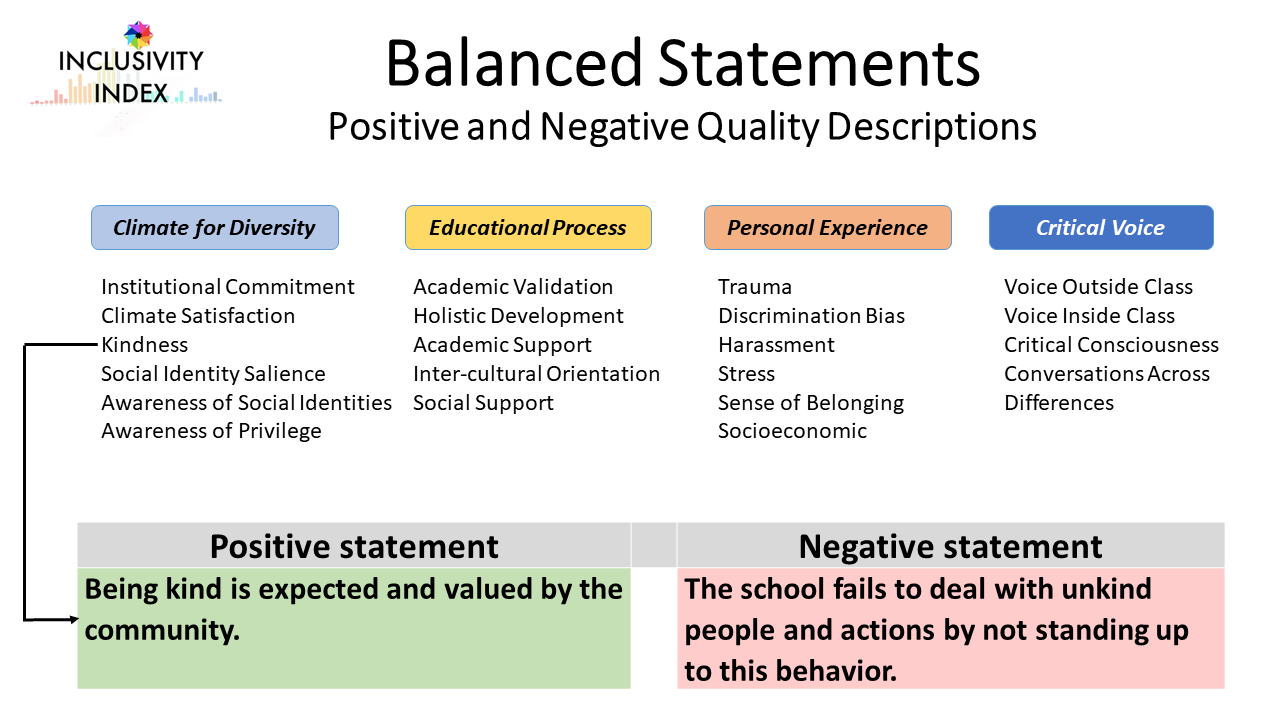
Measuring qualities: the Inclusivity Index is a choice-based survey built around a mirrored pair of statements that describe individual qualities. The “balanced statements” approach is described below:

Administering the survey: the survey uses the same structure and content philosophy throughout the K-12 range but modifies the specific content, number of measurements, and administrative approaches depending on the grade level.
The 7-12 Grade or Upper School survey measures 21 qualities and 14 demographics.
Students take the survey on their phones or computers at an assembly or in advisory groups
The 15-minute survey poses 28 sets of 3 positive or negative statements for the quality assessment portion and asks students 14 demographic identity selections
Faculty members answer the same 28 sets of quality statements and make 14 identity selections
Middle School students take a survey appropriate for Grades 4 - 8 that measures 18 qualities and 6 demographic identities
Students typically take the survey in a classroom with an independent support person (not one of their direct faculty members) in the classroom to help
The survey uses 24 sets of 3 positive and negative statements and 6 demographic selections.
Finishing times average 15 minutes, but some students finish in 10 to 12 minutes and some take over 20 minutes
The Lower School survey measures 12 qualities and 5 demographic identities
Grades 3-4 take the survey in a classroom with an independent support person (not one of their direct faculty members) in the classroom to help
The survey uses 16 sets of 3 positive and negative statements and 5 demographic selections
K-2 students complete the survey at home with three options, complete it themselves, complete it with parental help or the parent completes the survey
For parents who complete the survey for their child, the survey includes a tool where the parent can discuss the content and document the child’s inputs. The parent uses this tool as a guide to their choices.
People and History: the Inclusivity Index has been a collective effort of diverse minds, skills, and experiences that began in 2016. The key contributors, their contributions, and the years of building the survey we have today are helpful inputs for those wanting to better understand the value of the Inclusivity Index.
Common Questions: as schools interact with the survey, they often ask about how difficult it is to interpret, how it answers specific questions they have, whether it can be modified or edited, repeating it year after year… This section details the 10 most frequent questions we encounter and the responses we offer to schools.