Learn About the Inclusivity index
Common questions
There is so much data and information, can it just be simple?
To keep it simple, just focus on the Key Insights portion of the feedback. For a school’s first survey, this likely contains what you need to set priorities and progress over the next year. First-time schools typically choose two or three qualities and three to five identity groups to focus on and then discuss these with their faculty & staff. Some choose to delve deeper if necessary, and if so, they move to the Tableau files. Often, they engage a faculty member who is comfortable with data to install Tableau Reader and inform their questions and dialogue.
Thus, the Key Insights feedback gives you enough to consider. And further, we are always an email away to add perspective from our broader experience.
Any school is complex and dynamic. None would seem to fit standard analyses. Can Inclusivity Index feedback help with a school’s unique challenges and opportunities?
The 15-minute survey creates a large dataset of student decisions, 10,000 or more for every 100 students. This, in combination with neutrality and avoiding bias, builds a robust, high-fidelity model of the school, which can be assessed from many analytical perspectives. In combination with the archive of alternative schools, the survey does offer insight into these problems. The portfolio of Tableau tools and the associated analyses are geared to illuminate these issues and tailor the data to your questions, hypotheses, and observations. This is the real strength of the Inclusivity Index exercise. For reference to the archive of alternative schools, simply contact the Inclusivity Index team, who will provide reference data tailored to the issue.
Most of all, this work can be performed fast, simply, and transparently for the diverse set of perspectives at a school.
Can a school edit content, such as for age- and stage-appropriate statements or demographic terminology or selections?
Editing demographic questions is common and we work to accommodate requests. This primarily involves changing the terminology used to describe each demographic level. Political, ethnicity/race, gender, sexual orientation, and learning style are examples of demographics that school administrators have asked to modify, and in some cases, eliminate. These are changes we normally can make without compromising the data conversion process.
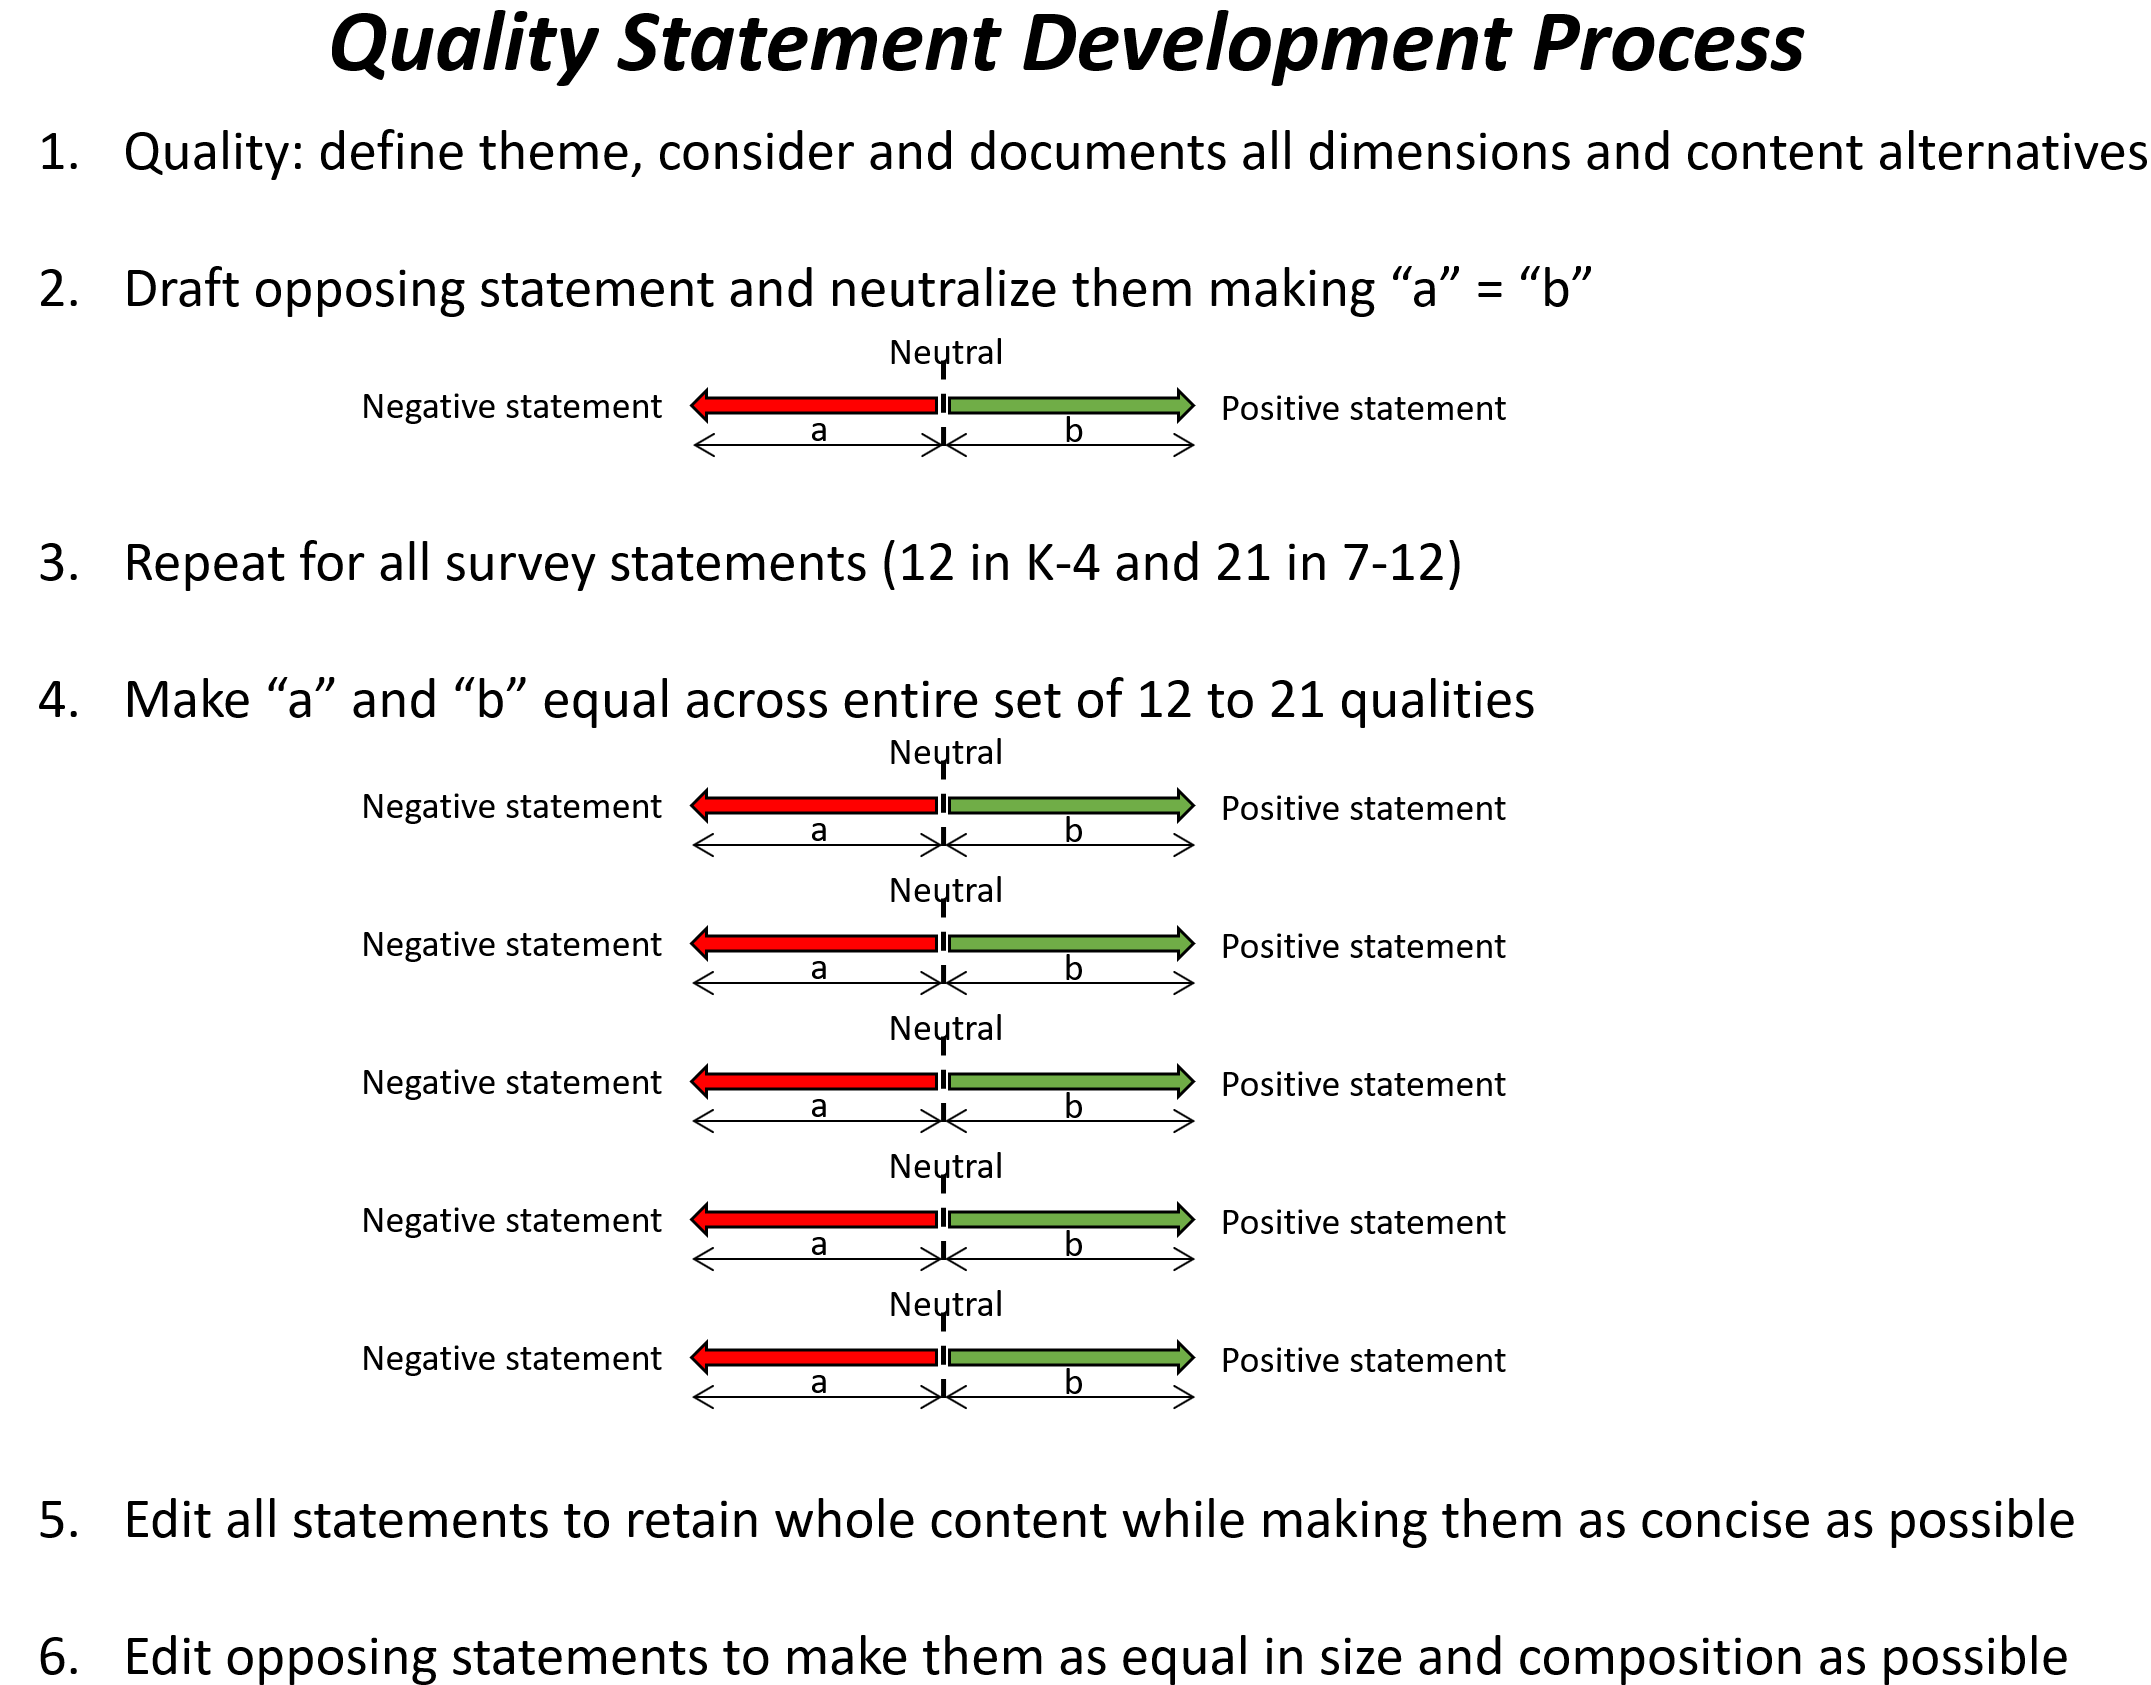
For quality statements, the Inclusivity Index has a well-honed process for changes shown in the graphic. When changes or improvements are proposed for any survey’s quality statements, we convene a board consisting of an independent third party from our survey family who is particularly accomplished and interested in the subject, Daniel Harris, who bridges knowledge of the survey with expertise in inclusivity and Charlie Peters who represents the research methodology.
Any change must respect the quality statement development process. For perspective, in 2020 and 2021 we made no changes to any survey, and in 2023 the 7-12 survey modified “Voice in Class” while the K-4 survey updated “Play.” Both improvements have been accepted.
What are the research methods for the Inclusivity Index and are they statistically significant?
The section of the website “Inclusivity Index in Depth” titled Validity of the Inclusivity Index is devoted to this question. It describes the methodology and compares it to alternatives for research in diversity, equity, and inclusion. The methods used are based on mature methodologies that have been shown to produce reliable and significant results, both in absolute terms and relative to alternative measures. Most importantly, all but the smallest school applications exceed the statistical minimums for sample size and are designed to minimize biases such as sampling, cultural, and anonymity. Some analytical tools such as the “Support and Risk Factor” analyses use p-statistics (statistical probabilities) as the key selection factor in the process.
That said, the goal is to measure and improve “inclusion.” Since there are no absolute measures of inclusion to use as a benchmark, there is no comparison available as a quantified measurement. The proof then rests on the effectiveness of the applied results. Do schools affirm the results? Are they useful in framing their actions? Does the tool become an integral part of a school’s improvement process?
Over seven years the answer to these questions has been yes.
What is the accuracy of a one-and-done survey?
First-time surveys benchmark a school’s starting position. Most schools follow with a second survey within one or two years to assess the impact of their actions. Instances of a “one and done” approach are rare.
As to the term “accuracy,” the first piece of evidence is that administration seldom if ever disagrees with the results. Instead, common responses range from verification that “we didn’t know that” to confirming challenges or identifying anticipated unique traits of the school. The fact that most/all perform a second survey is a further endorsement. The fact that every school improved from survey to survey in the first 5 years of the Inclusivity Index further supports the accuracy of the benchmark. In essence, the survey steered administrations to work on the right issues. Two years of surveys satisfy a lot of schools. Still, other schools find richness in the insights over many years by continuing with the survey. The Inclusivity Index’s collective effort benefits from many years of data as it supports the entire family of trend analyses. The longest dataset so far is seven years.
How is information communicated with the various elements of the school community?
The Inclusivity Index team sends the school the Key Insights set of slides and the Tableau Tool file accessible to anyone through the free Tableau Reader. Additionally, we offer to draft on request our interpretation of the results. The interpretation exercise reflects what we see during the conversion process and draws on the data archives of all school surveys since 2017. It also reflects knowledge of progress and challenges other schools experienced confronting their opportunities. The summary is delivered with a disclaimer – the fact that we begin from a perspective of pure objectivity, knowing nothing about your school, can be a positive. Conversely, the fact that we know nothing about your school can also be a hindrance, if not considered by the recipient.
After interpreting the data, schools vary in what they communicate to their constituencies. Constituencies may include students, faculty, administrations, trustees, and/or parents and caregivers. Most schools first work on their results with interested administrators, often appointing an oversight team. Next, they discuss insights with the faculty since alignment is almost always a significant, but correctable input. Depending on the school, the trustees can have a keen interest. If this is particularly challenging to the school, we offer to participate in the trustee meeting.
Some schools present results to students. Some present to parents. The survey is objective and neutral. Its purpose is to inform dialogue and add perspective to everyone’s thoughts. For this reason, it should help group discussions. If any member of any constituency has a hypothesis, the data can add insight. The Inclusivity Index results represent the comprehensive inputs of the students’ realities and are both neutral and robust. This perspective is more insightful than any view expressed by an individual or subgroup.
What is the calendar and timeline?
Schools choose to do the survey in the December through April time frame. We offer it in the 10 days after Thanksgiving and some surveys have been administered during this time. Most surveys are given in late January or February as well as before a school’s spring vacation.
How can the survey be offered for free? Is it truly free?
The Inclusivity Index infrastructure is built on software and internet services based on annual fees supported by donations. There is no added infrastructure cost to applying an incremental survey. The only additional load on the Inclusivity Index team is the time it takes to interface with a school and convert the data to results. The free aspect is not absolute. The real work is done at the school during the investigation, administration, and interpretation phases. We, the collective school team and the Inclusivity Index team, benefit from the joy of helping the students, as proven by the improved results comparing year-to-year surveys.
From a dollar and cents perspective, it is truly free. The Inclusivity Index has never taken a single cent from any school.
How is the data analyzed?
Once the school declares the survey complete and authorizes closure, we enter the Conversion Process. This is all automated and takes in theory, about an hour. In reality, we normally take 3 or 4 hours to observe the results as a new school, or in comparison to a school’s most recent survey to make certain the new output is sensible and error-free. This process uses tools from the market research survey (Sawtooth), Excel for data prep, a very large Excel tool built to find particularly negative groups from an Overall Score perspective as well as for each of the 12 to 21 qualities and then Tableau for more analyses. The deep but highly automated conversion process is key to providing the survey to any school for free.
Schools then receive a 15 – 20 slide summary called Key Insights and a Tableau tool where they can do their own data mining of the deeper data set. Most schools feel they get so much feedback in the overview, that it proves sufficient to proceed. Other schools go deeper by appointing someone from their community who is comfortable with the data mining to query the larger database and support hypothesis debates among the administrators and perhaps trustees.
What are the research methods for the Inclusivity Index, and are they statistically significant?
The section of the website titled Validity of the Inclusivity Index is devoted to this question. It describes the methodology and compares it to alternatives for research in the diversity, equity, and inclusion realm. The methods used are based on mature methodologies that have been shown to produce reliable and significant results, both in absolute terms and relative to existing measures. Most importantly, the applications exceed the statistical minimums for sample size and, through design, eliminate many biases, such as sampling and anonymity. Some tools, such as the “Support and Risk Factor” analyses, use p-statistics (statistical probabilities) as the key selection factor in the analytical process.
That said, the goal is to measure and improve “inclusion.” Since there are no alternative absolute measures of inclusion to use as a benchmark, there is no analysis of this specific measurement. The proof then rests on the effectiveness of the application of the results. Do schools affirm the results? Are they useful in framing their actions? Does the tool become an integral part of a process that helps schools improve?
Over seven years, the answer to these questions has been yes.